
This is a guest post from Adam Dinsmore, Evaluation Officer at the Wellcome Trust.
The penultimate session of 2:AM Amsterdam focused on efforts to develop means of tracking the use of research outputs other than the peer reviewed article. Be they products of the internet age like software and code, or antecedents to it like datasets and books.
The session began with Josh Borrow of Durham University, who presented a blueprint for assessing the societal impact achieved by public engagement with science developed in partnership with Pedro Russo of Leiden Observatory. Josh began by echoing a theme from Simon Singh’s keynote address – that those researchers who don’t wish to engage with the public shouldn’t have to – but followed by saying that those who do wish to engage should be appropriately supported and rewarded.
At present this doesn’t seem to be the case. When asked about factors which impede them from engaging with the public researchers most commonly cited a lack of time; suggesting that time spent engaging with the public doesn’t contribute to career development in the same way that research or teaching does. While research has become more progressively more accessible to the public through outreach activities and the Open Access movement, academia is yet to put proper incentives in place to reward those who make themselves and their work more discoverable.
As a partial solution, Josh suggested a move towards a system of public engagement mentorship within academia, analogous to the student-supervisor relationships already present in research. In Josh’s proposed four-point model (illustrated below) researchers and their mentors would keep detailed records of the planning and implementation of their public engagement activities, thereby facilitating improved post-hoc evaluation. Researchers would also be encouraged to build up public engagement portfolios which could be presented as evidence of public good to funding and tenure boards.
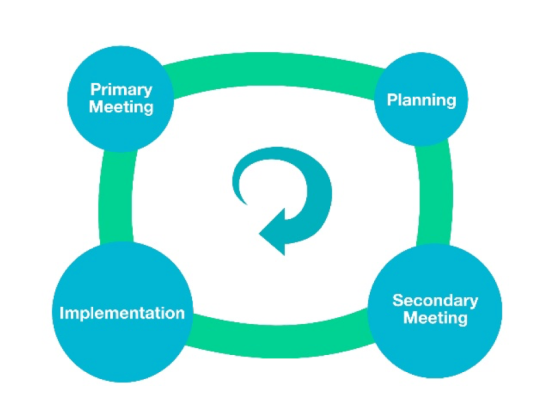
Figure taken from A Blueprint for Assessing Societal Impact Through Public Engagement (Borrow & Russo, 2015).
Josh ended his presentation with an appeal to the altmetric community to help public engagement practitioners develop useful metrics to help incentivise public engagement among researchers (and provided a link to an arXiv paper for those wanting to read more).
Next on stage was Robin Haunschild of the Max Planck Institute for Solid State Research, who presented the results of a detailed study of Mendeley bookmarking activity across 1.2m DOIs published in 2012. Robin presented his results as answers to three explicit research questions.
- Are there differences and similarities between disciplines in bookmarking papers?
- How do researchers in different career stages differ in terms of bookmarking papers?
- Are there patterns of similar readership between specific countries?
To probe these questions Robin applied the community-finding algorithm of Blondel, Guillaume, Lambiotte, and Lefebvre (2008) to his dataset, from which four distinct disciplinary communities arose. These were labelled by Robin as i) biology and geo-sciences, ii) social science and humanities, iii) bio-medical sciences, iv) natural science and engineering. In all four groups the category with the addition ‘miscellaneous’ was the most commonly bookmarked.
Next Robin showed that students and early-career researchers accounted for the majority of Mendeley readership activity in his sample, including masters students, PhDs, and postdocs. These were also the most commonly interconnected communities, though all career stage groups were connected to some extent.
Regarding patterns of Mendeley use in different countries the Blondel algorithm appeared broadly to group countries according to development. Four communities of nations were identified. The first (in order of size) containing 53 nations, of which a majority were members of the OECD (including the US, UK, Germany, France, Japan, and Canada, as well as Russia and China). Next was a smaller group including Brazil, Mexico, and Norway, followed by a group of 10 countries of which the largest nodes were Nigeria and Niger, and a fourth group containing only two countries.
Robin was followed by Sunje Dallmeier-Tiessen of CERN, who presented case studies of two tools designed to levy the potential of altmetrics to track “anything but the paper” in the ostensibly disparate fields of social science and high energy physics. Sunje’s work is an attempt to move beyond what she calls the article-data paradigm, citing CERN’s upcoming release of several thousand Monte Carlo simulations as an example of knowledge transfer with little existing infrastructure allowing us to track their use, and therefore incentivise further openness.
The first case study detailed the Dataverse data repository currently in operation at Harvard University. Most of the items in the repository belong to the social sciences, though it is open to all researchers and efforts are underway to encourage use by other disciplines. The Dataverse is able to integrate with collaborative workspaces and analytical software such as ROpenSci.
The second tool described by Sunje was an analysis preservation tool currently being developed by CERN, which counts the use and re-use of non-traditional objects (NTOs; like the code underlying the Monte Carlo simulations mentioned above). The tool currently focuses mainly on citation of the NTOs, as there appears to be little demand for altmetrics (though Sunje wondered whether providing altmetrics might cultivate demand among researchers).
Martin Fenner of DataCite then took to the 2:AM stage, initially flanked by a slide set written in Comic Sans as the result of a losing bet made in an Amsterdamian drinkery the previous evening. Martin presented the early results of the ‘Making Data Count’ project, a joint undertaking of California Digital Library, PLOS, and DataOne.
Some initial scoping work surveyed research managers regarding the types of metric they would like access to, with citations and downloads rated highest. The team therefore worked to adapt LaGotto (PLOS’s open source metric gathering software) to collect citation and download stats for NTOs without DOIs in the DataOne repository network. As datasets in particular are seldom cited in the reference lists of academic articles – often appearing as URLs in the main body of the article instead – the tool had to be configured to search whole articles.
The tool was written to collect two sets of usage stats; those which excluded ‘good’ machines like ruby and java clients in accordance with Counter regulations, and those which didn’t (‘bad’ bots were removed from both counts). Both sets of usage data were very similar, suggesting that Counter compliance likely isn’t necessary when preparing dataset usage statistics. Martin concluded by mentioning the group’s plans to integrate the tool with other client applications and turn it into a service after the research project is concluded.
The session literally and figuratively built to a crescendo as Martijn Roelandse of Springer spoke to the audience about BookMetrix, a free service developed by Springer with assistance from Altmetric, which provides data on the attention received by books. Books (including monographs and conference proceedings) have always been more important to certain parts of the social sciences and humanities than peer reviewed articles, but until now little has been done to help researchers provide evidence of the reach that these outputs have.
Martijn began by showing BookMetrix’s submission to the 2015 ALPSP Awards – a 2 minute video featuring short descriptions of BookMetrix’s various functions intercut with clips from La maquina de escribir (a piece of orchestral music featuring a flamboyant soloist rapping at a typewriter, presumably working on a new submission to Springer).
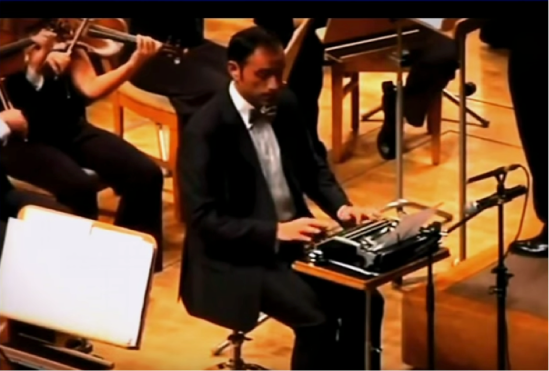
Still from La maquina de escribir, de L.Anderson (Solista: Alfredo Anaya). LIO EN LOS GRANDES ALMACENES, featured in Martijn’s talk.
Some of the data coming out of the service has been surprising. Across the 230,000 books being tracked by BookMetrix the average number of citations is 20 and the citation half life somewhere between 20 and 30 years. ‘Old’ content (i.e. that published before 2000) still appears to accrue significant readership and citations. The service also allows users to benchmark disciplines against eachother to compare rates of book citations, and permits an analysis at the chapter level as well as the book level.
As scholars continue to find new and innovative ways to share the outputs of their research with users via the web research managers must respond by adequately tracking this behaviour, and providing worthy incentives for researchers wishing to make their work as discoverable as possible. The talks in this session gave an interesting glimpse into how this is already being done.


 This is a guest post from
  Among the biggest developments in the UK’s metrics debate since 1:AM was the publication of
